 Compounding Energy
Talk to us
Compounding Energy
Talk to us
Compounding Energy
Talk to us
Compounding Energy
Talk to us
We model the grid and the weather that drives it, then solve that model for prices, generation and what to build next. GB is modelled by transmission zone, Europe by bidding zone and the US by node. Every forecast is saved before the market settles and scored in public.
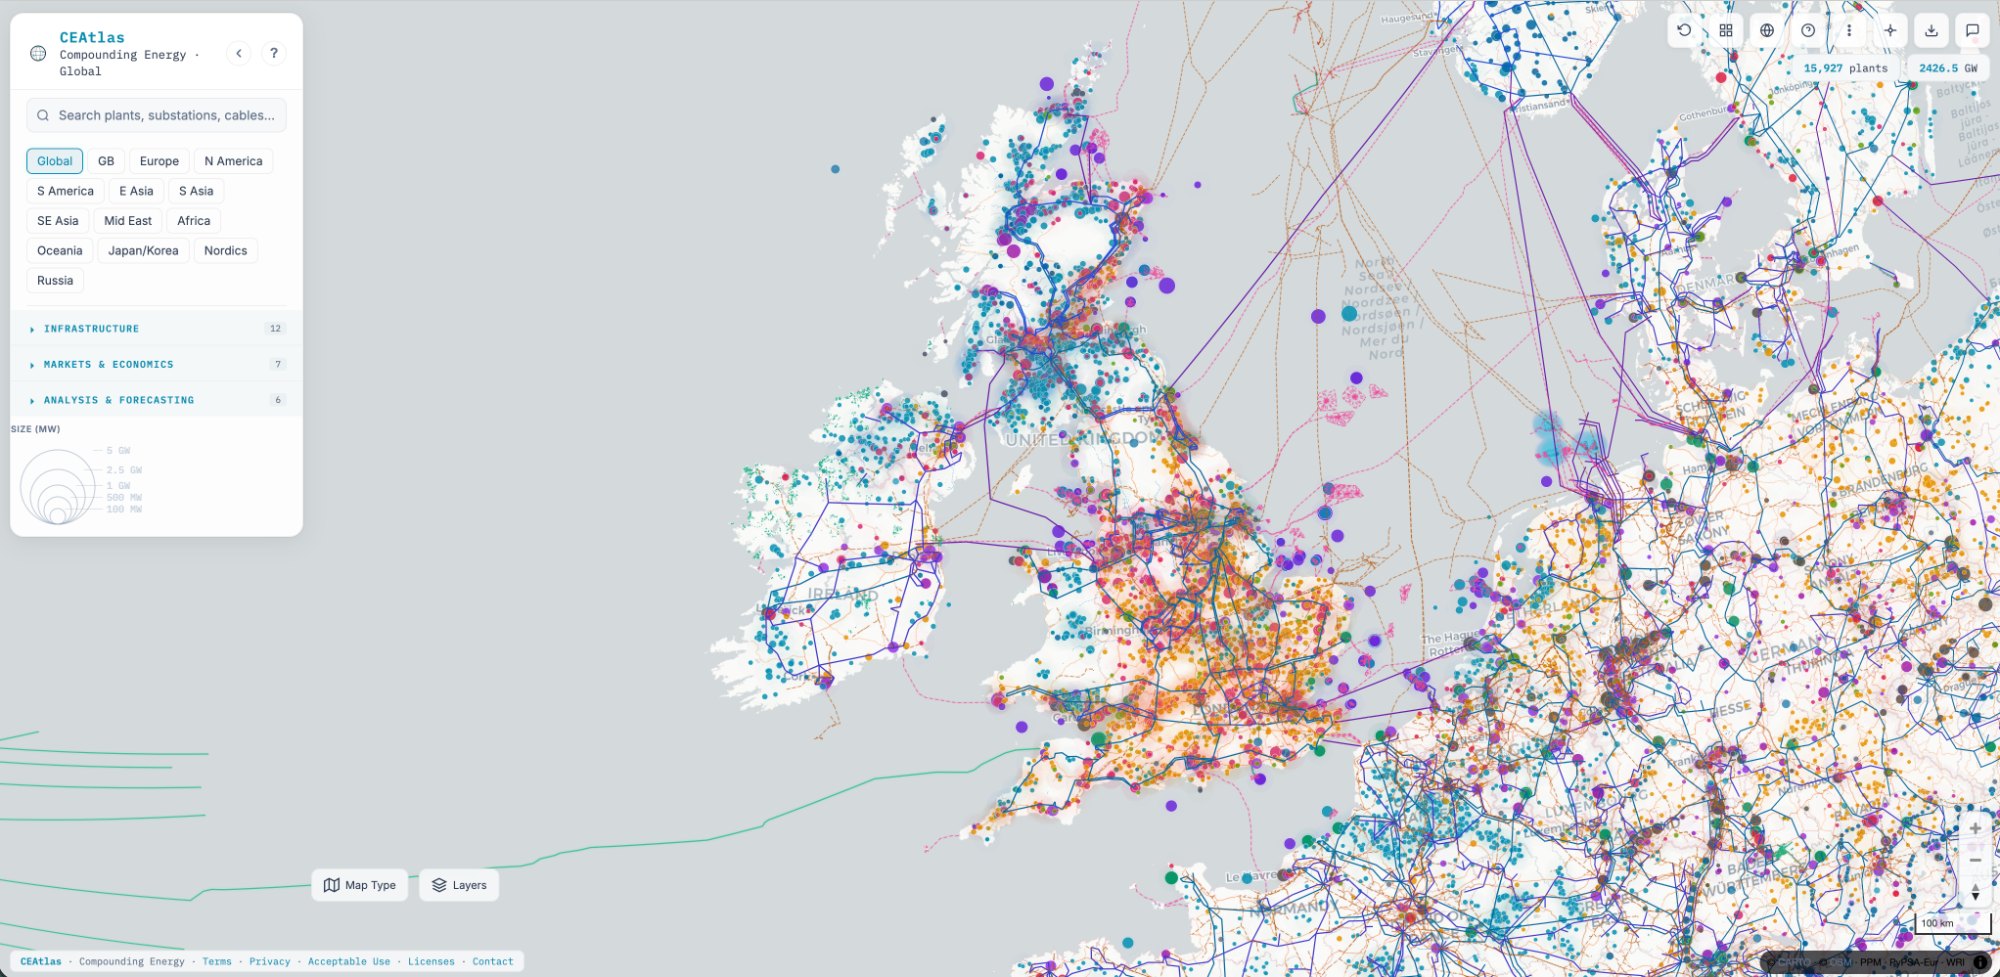

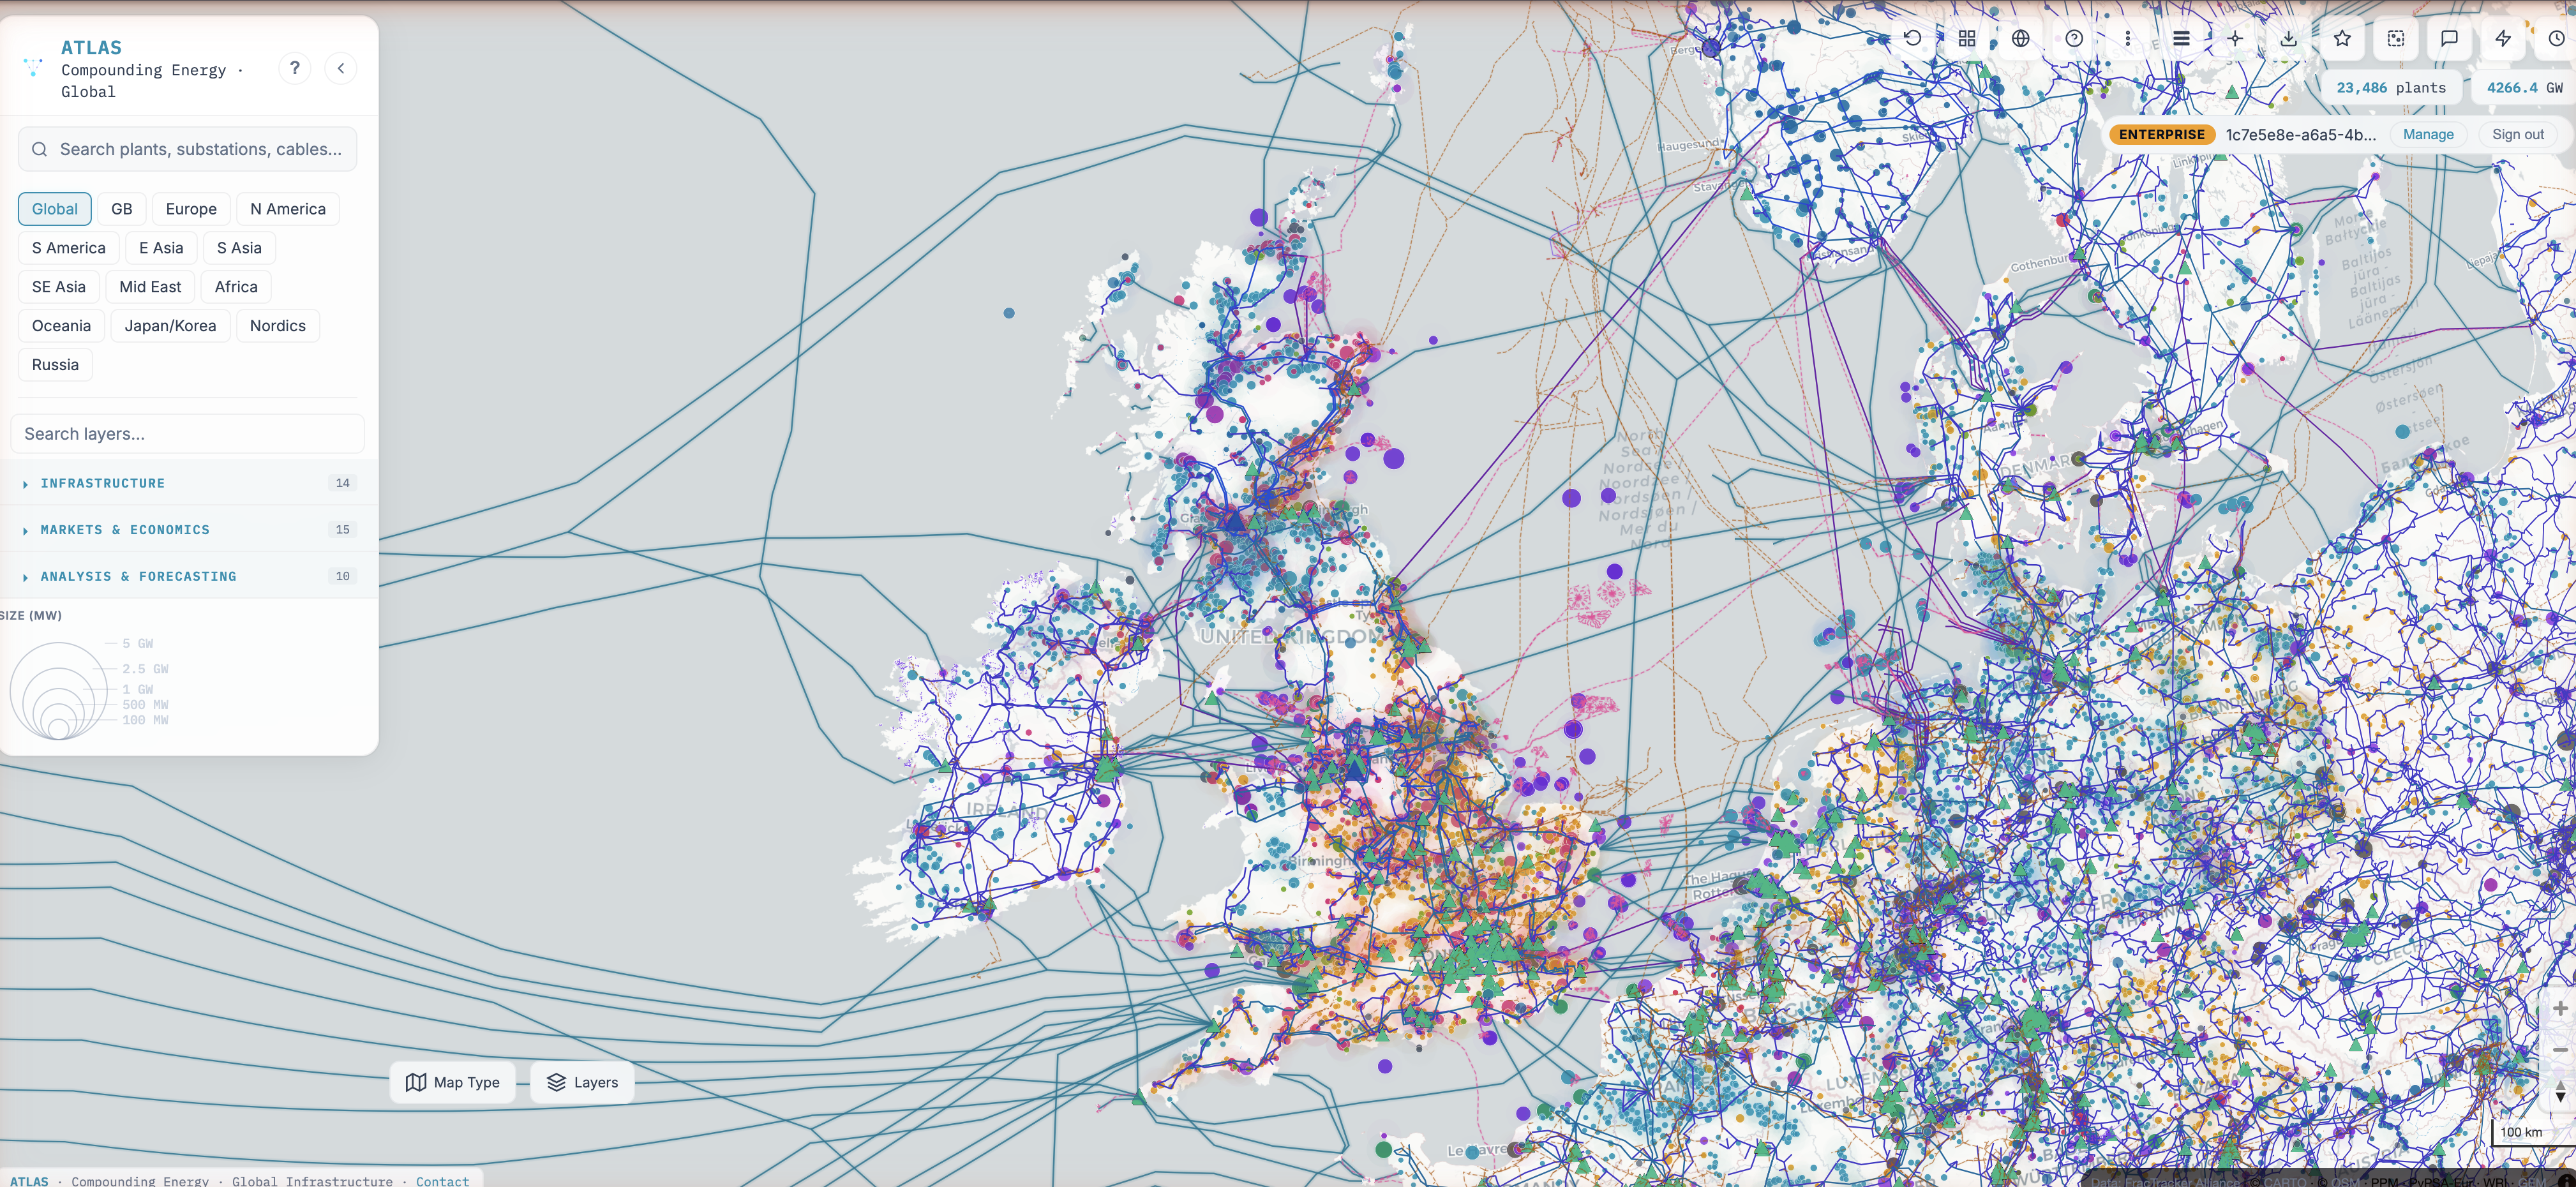
CEAtlas is a map of the world's power system: 214,598 power plants, 688,039 transmission-line features and 701,304 substations (30 Sep 2026), with live prices and our GB, European and US forecasts drawn on top. Site screening takes minutes. It tells you whether a site can connect, what it would earn, and whether it could run on clean power every hour of the year.
The new United States tab has 33 layers, 29 of them free: utility territories, every wind turbine and utility-scale solar farm, gas supply, siting hazards, and the build pipeline from each monthly EIA-860M release.
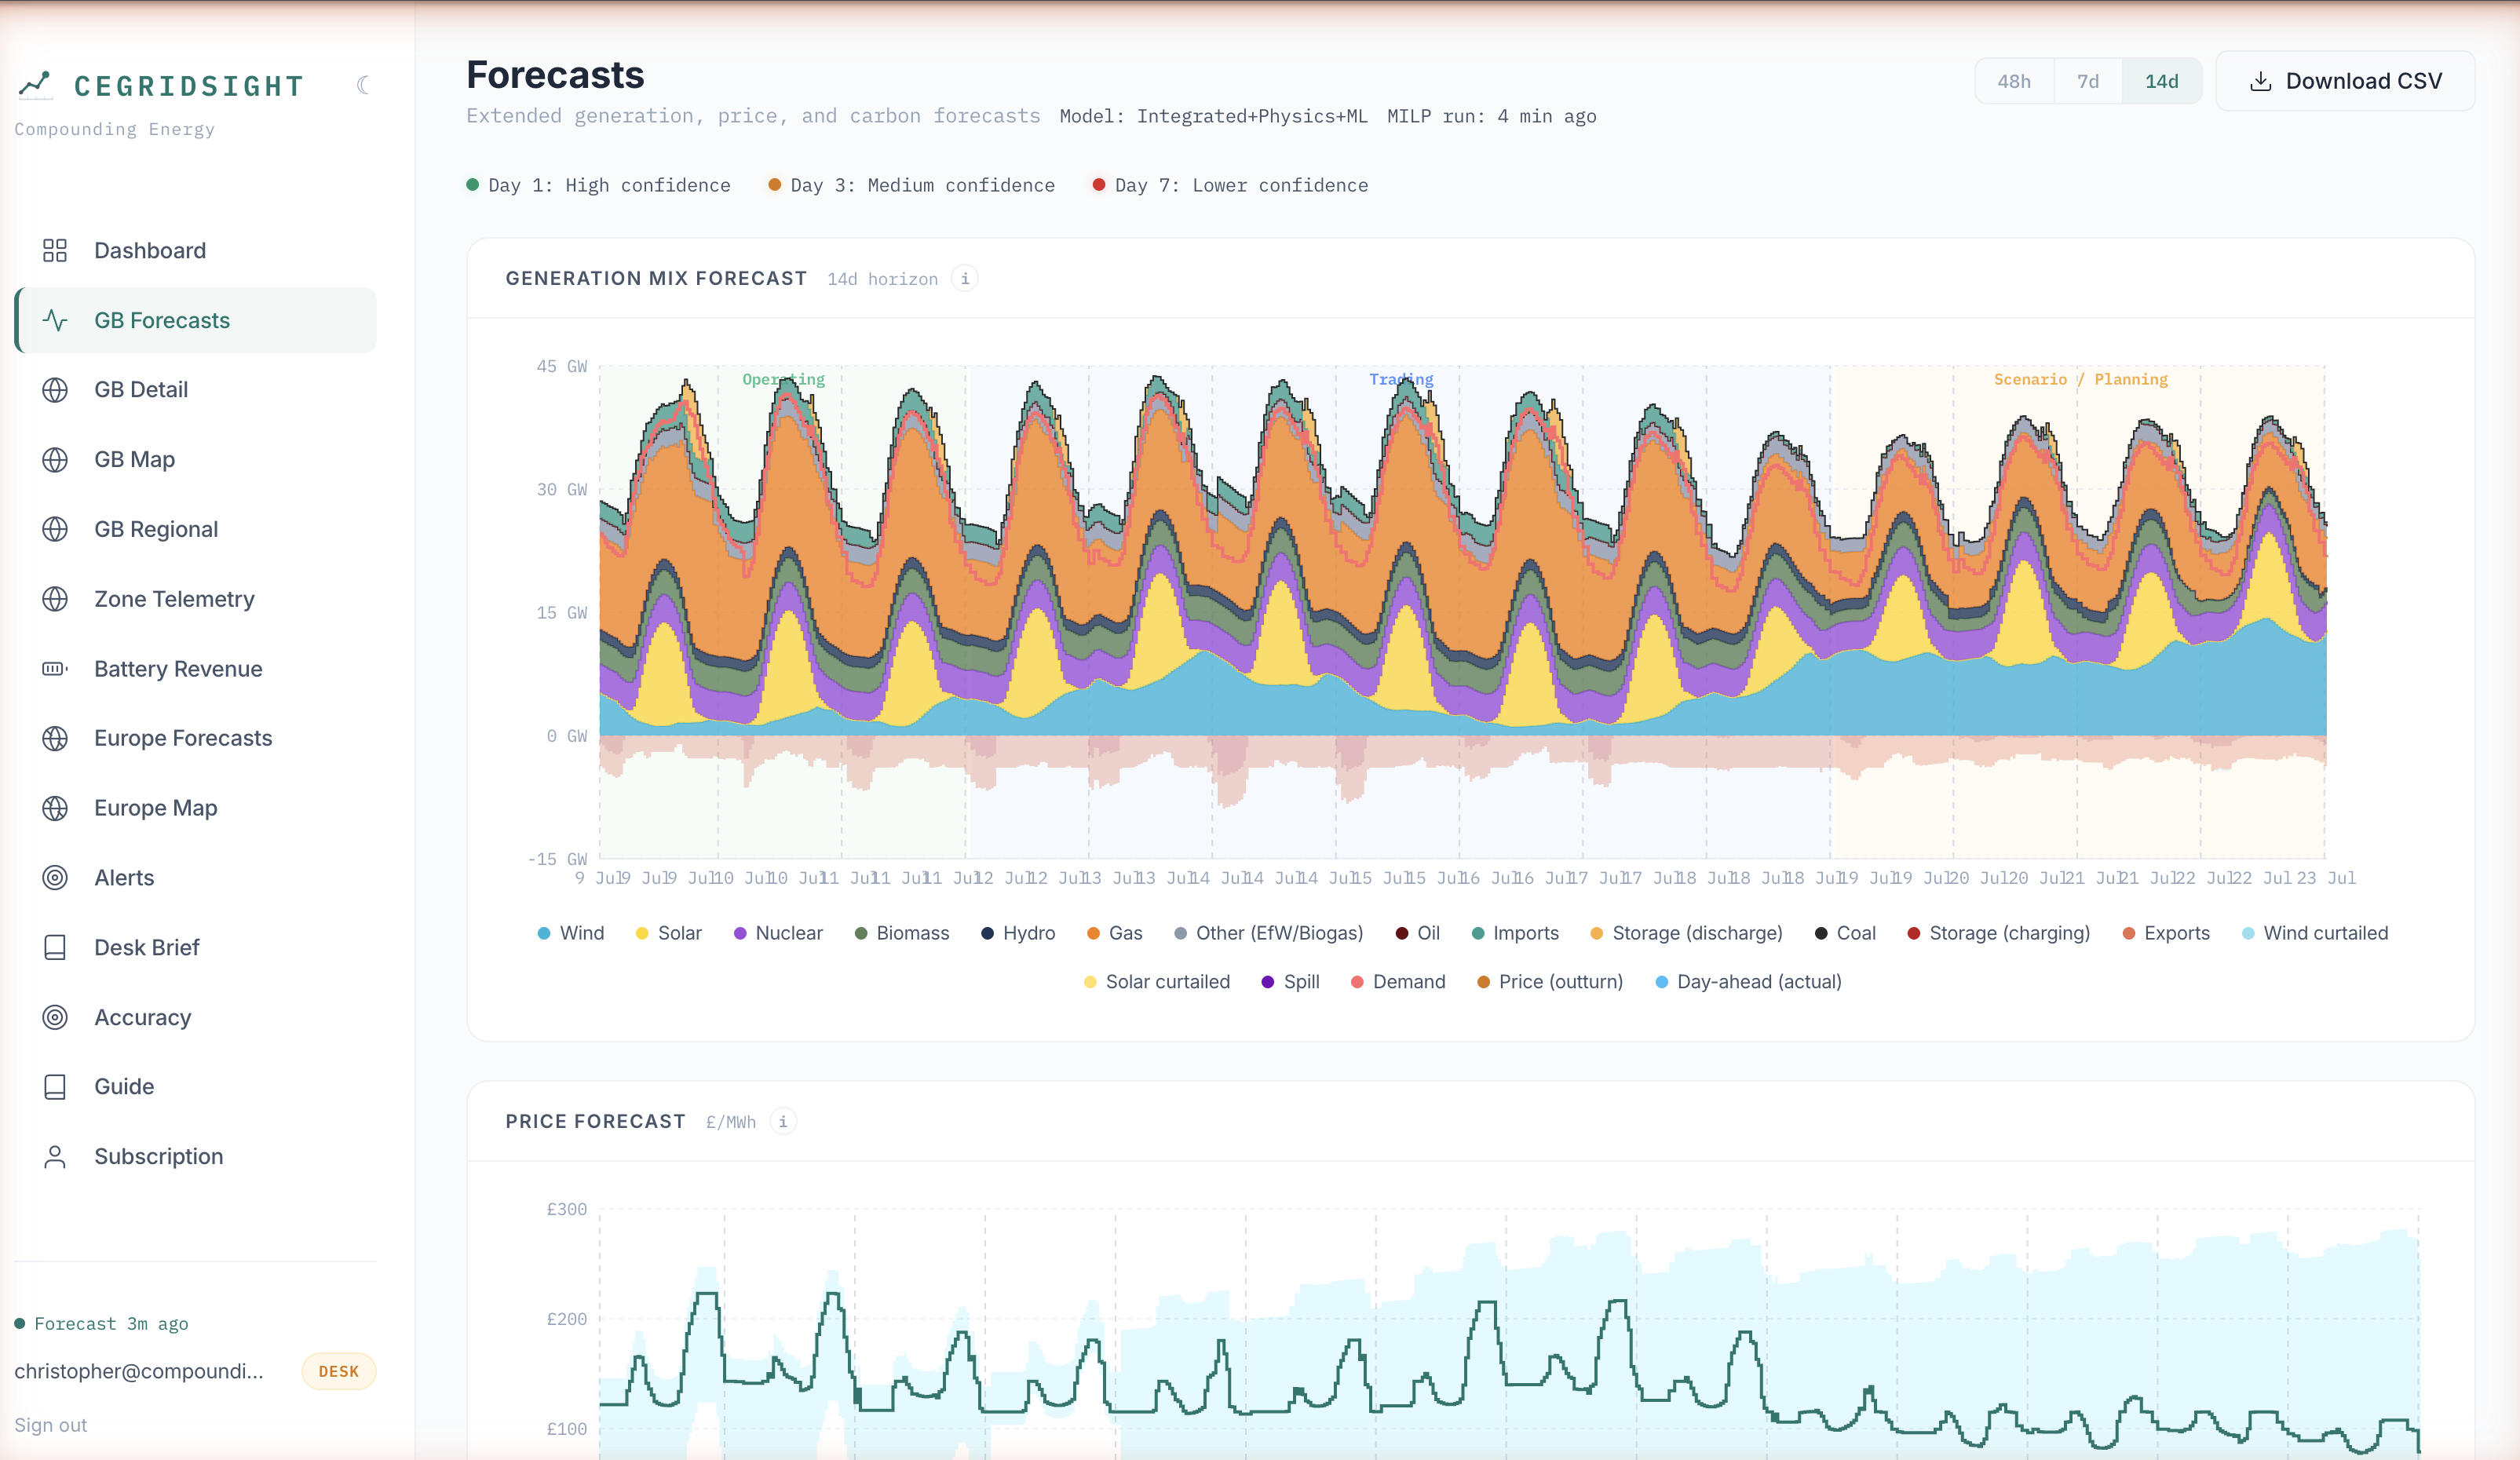

CEGridSight forecasts half-hourly electricity prices 14 days ahead for 43 zones: the 17 NESO transmission zones in GB and 26 European bidding zones, coupled in one solve. Weather forecasts set demand and wind and solar output. A two-stage linear programme with relaxed unit commitment then dispatches every plant, and the GB price comes from the dual of the national energy balance. It re-solves four times a day, with a 30-minute nowcast in between.
Every forecast is frozen before settlement and graded on a public track record, with GB scored against Elexon's settled index.

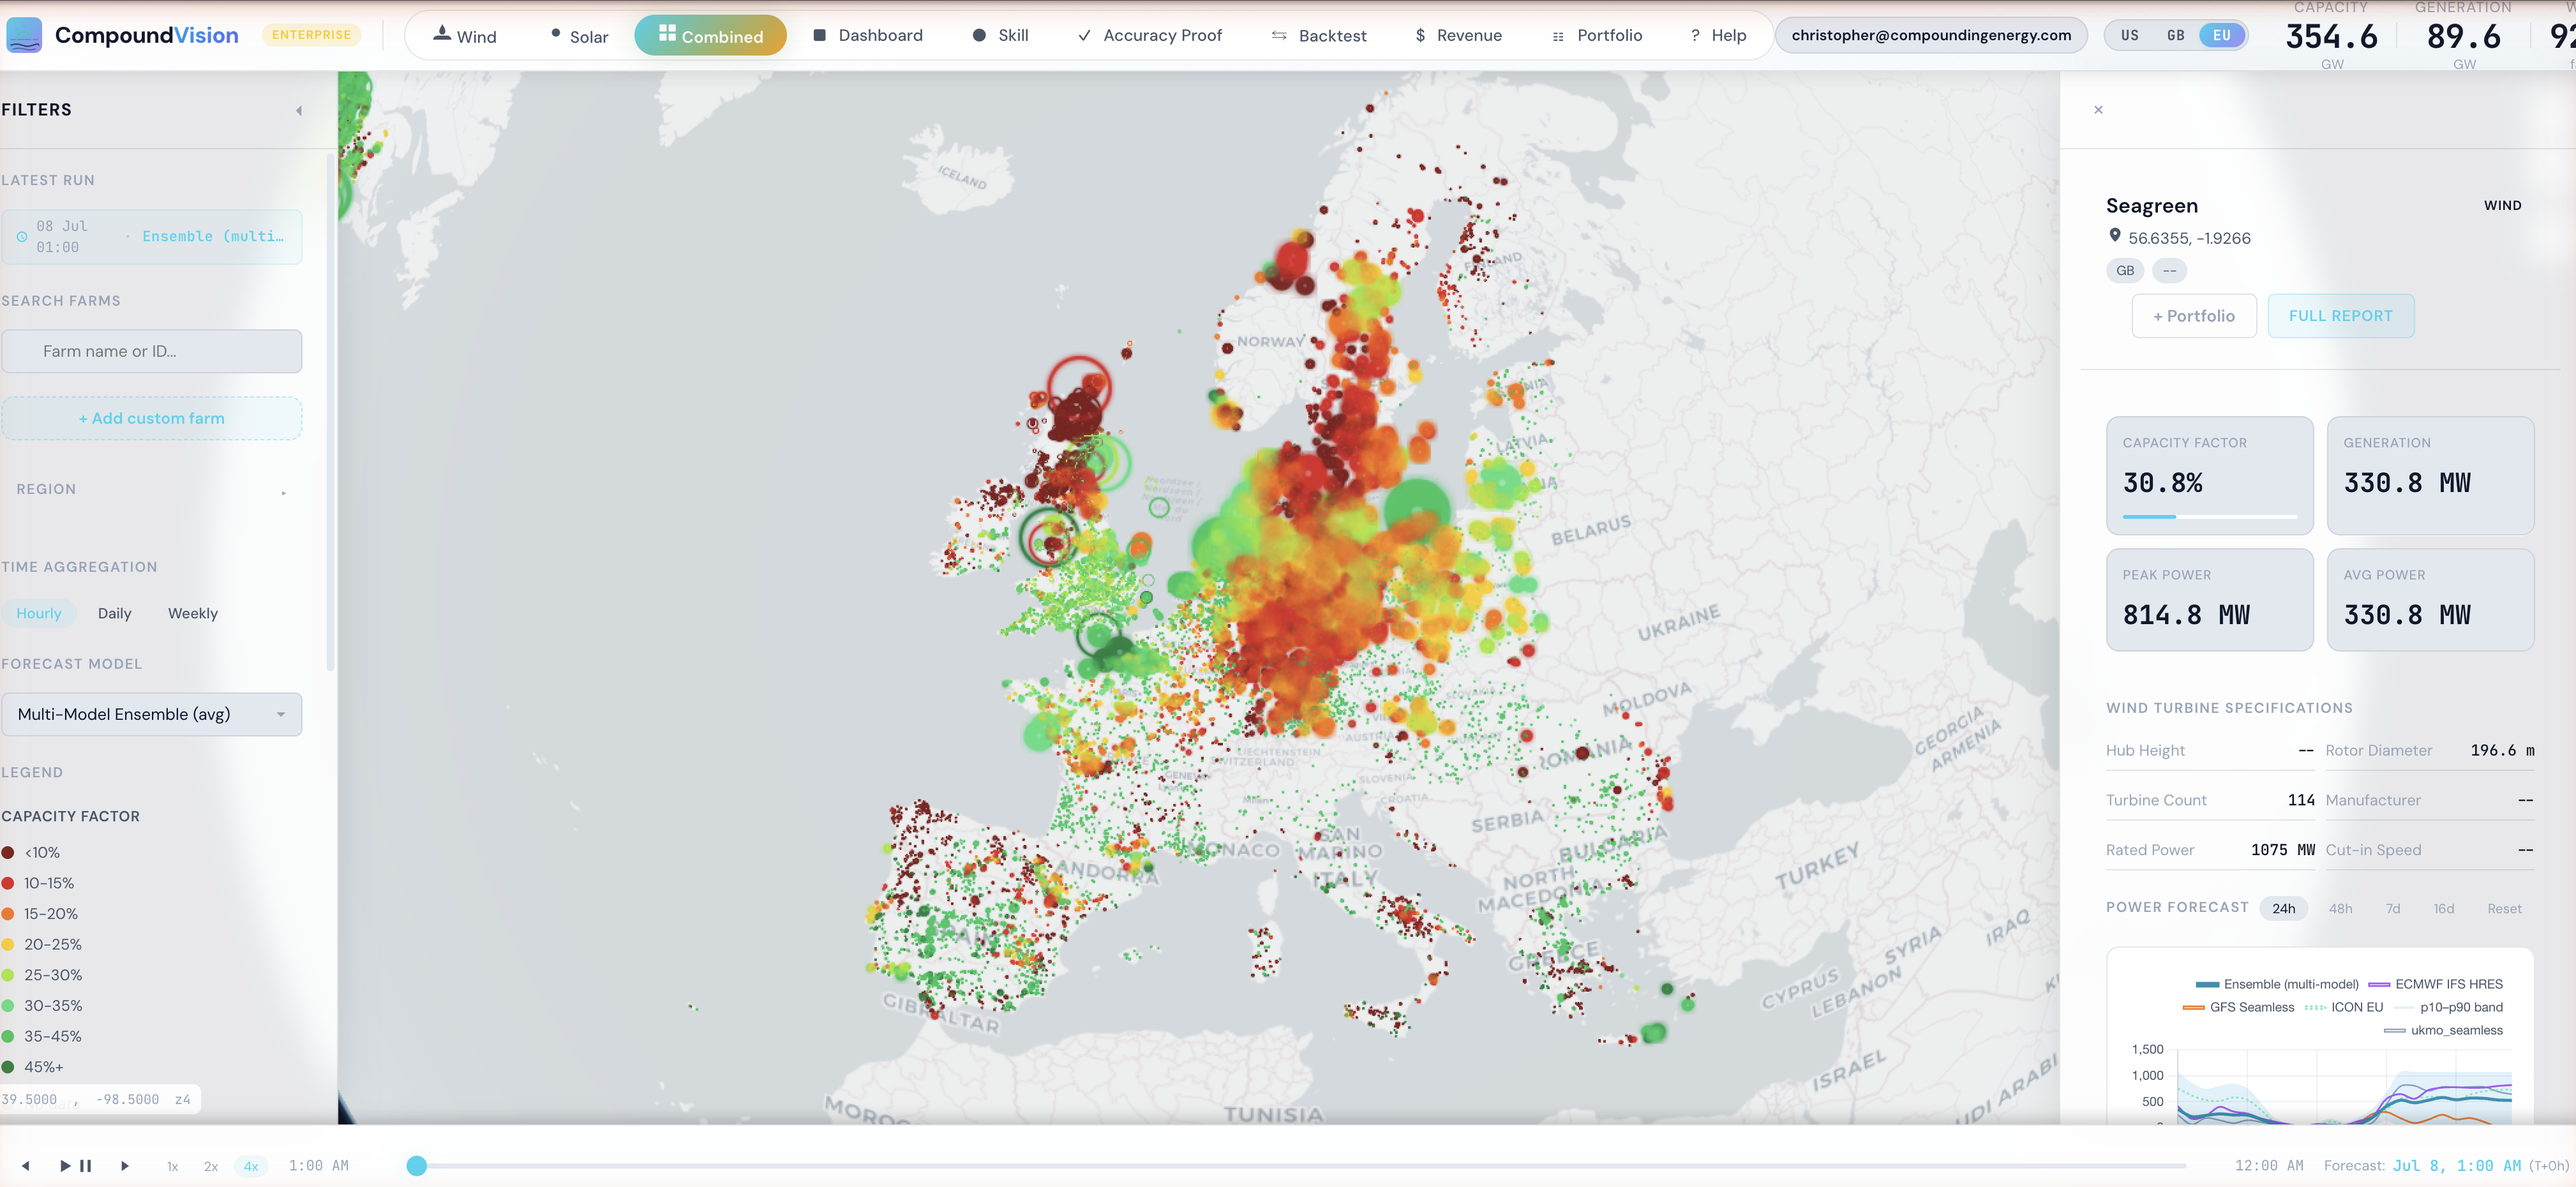
CompoundVision forecasts about 30,000 wind and solar farms in the US, GB and Europe, hourly and up to 16 days ahead: roughly 1,067 GW of nameplate including projects in testing, construction and planning (30 Sep 2026). Each farm is modelled on its own, from the weather at the site and the equipment installed there. For wind that means Monin–Obukhov shear and stability, the turbine's power curve rescaled for air density under IEC 61400-12-1, and Bastankhah–Porté-Agel Gaussian wakes. For solar it means NREL's solar position algorithm, Perez transposition, cell temperature and inverter clipping. When a forecast misses, you can see which step caused it.
Regional skill scores for lead days 1 to 16 are published daily, negative scores included. On the GB Accuracy Proof (computed 30 Sep 2026, settlement-meter data to 22 Sep), fitting each farm's power curve to its Elexon meter cut error for 92 of 93 farms scored, by 43% at the median and 44% weighted by capacity, against a generic IEC curve on held-out days. That is a test of the power curve alone. It does not measure the full forecast, and it is not a comparison with other forecasters.
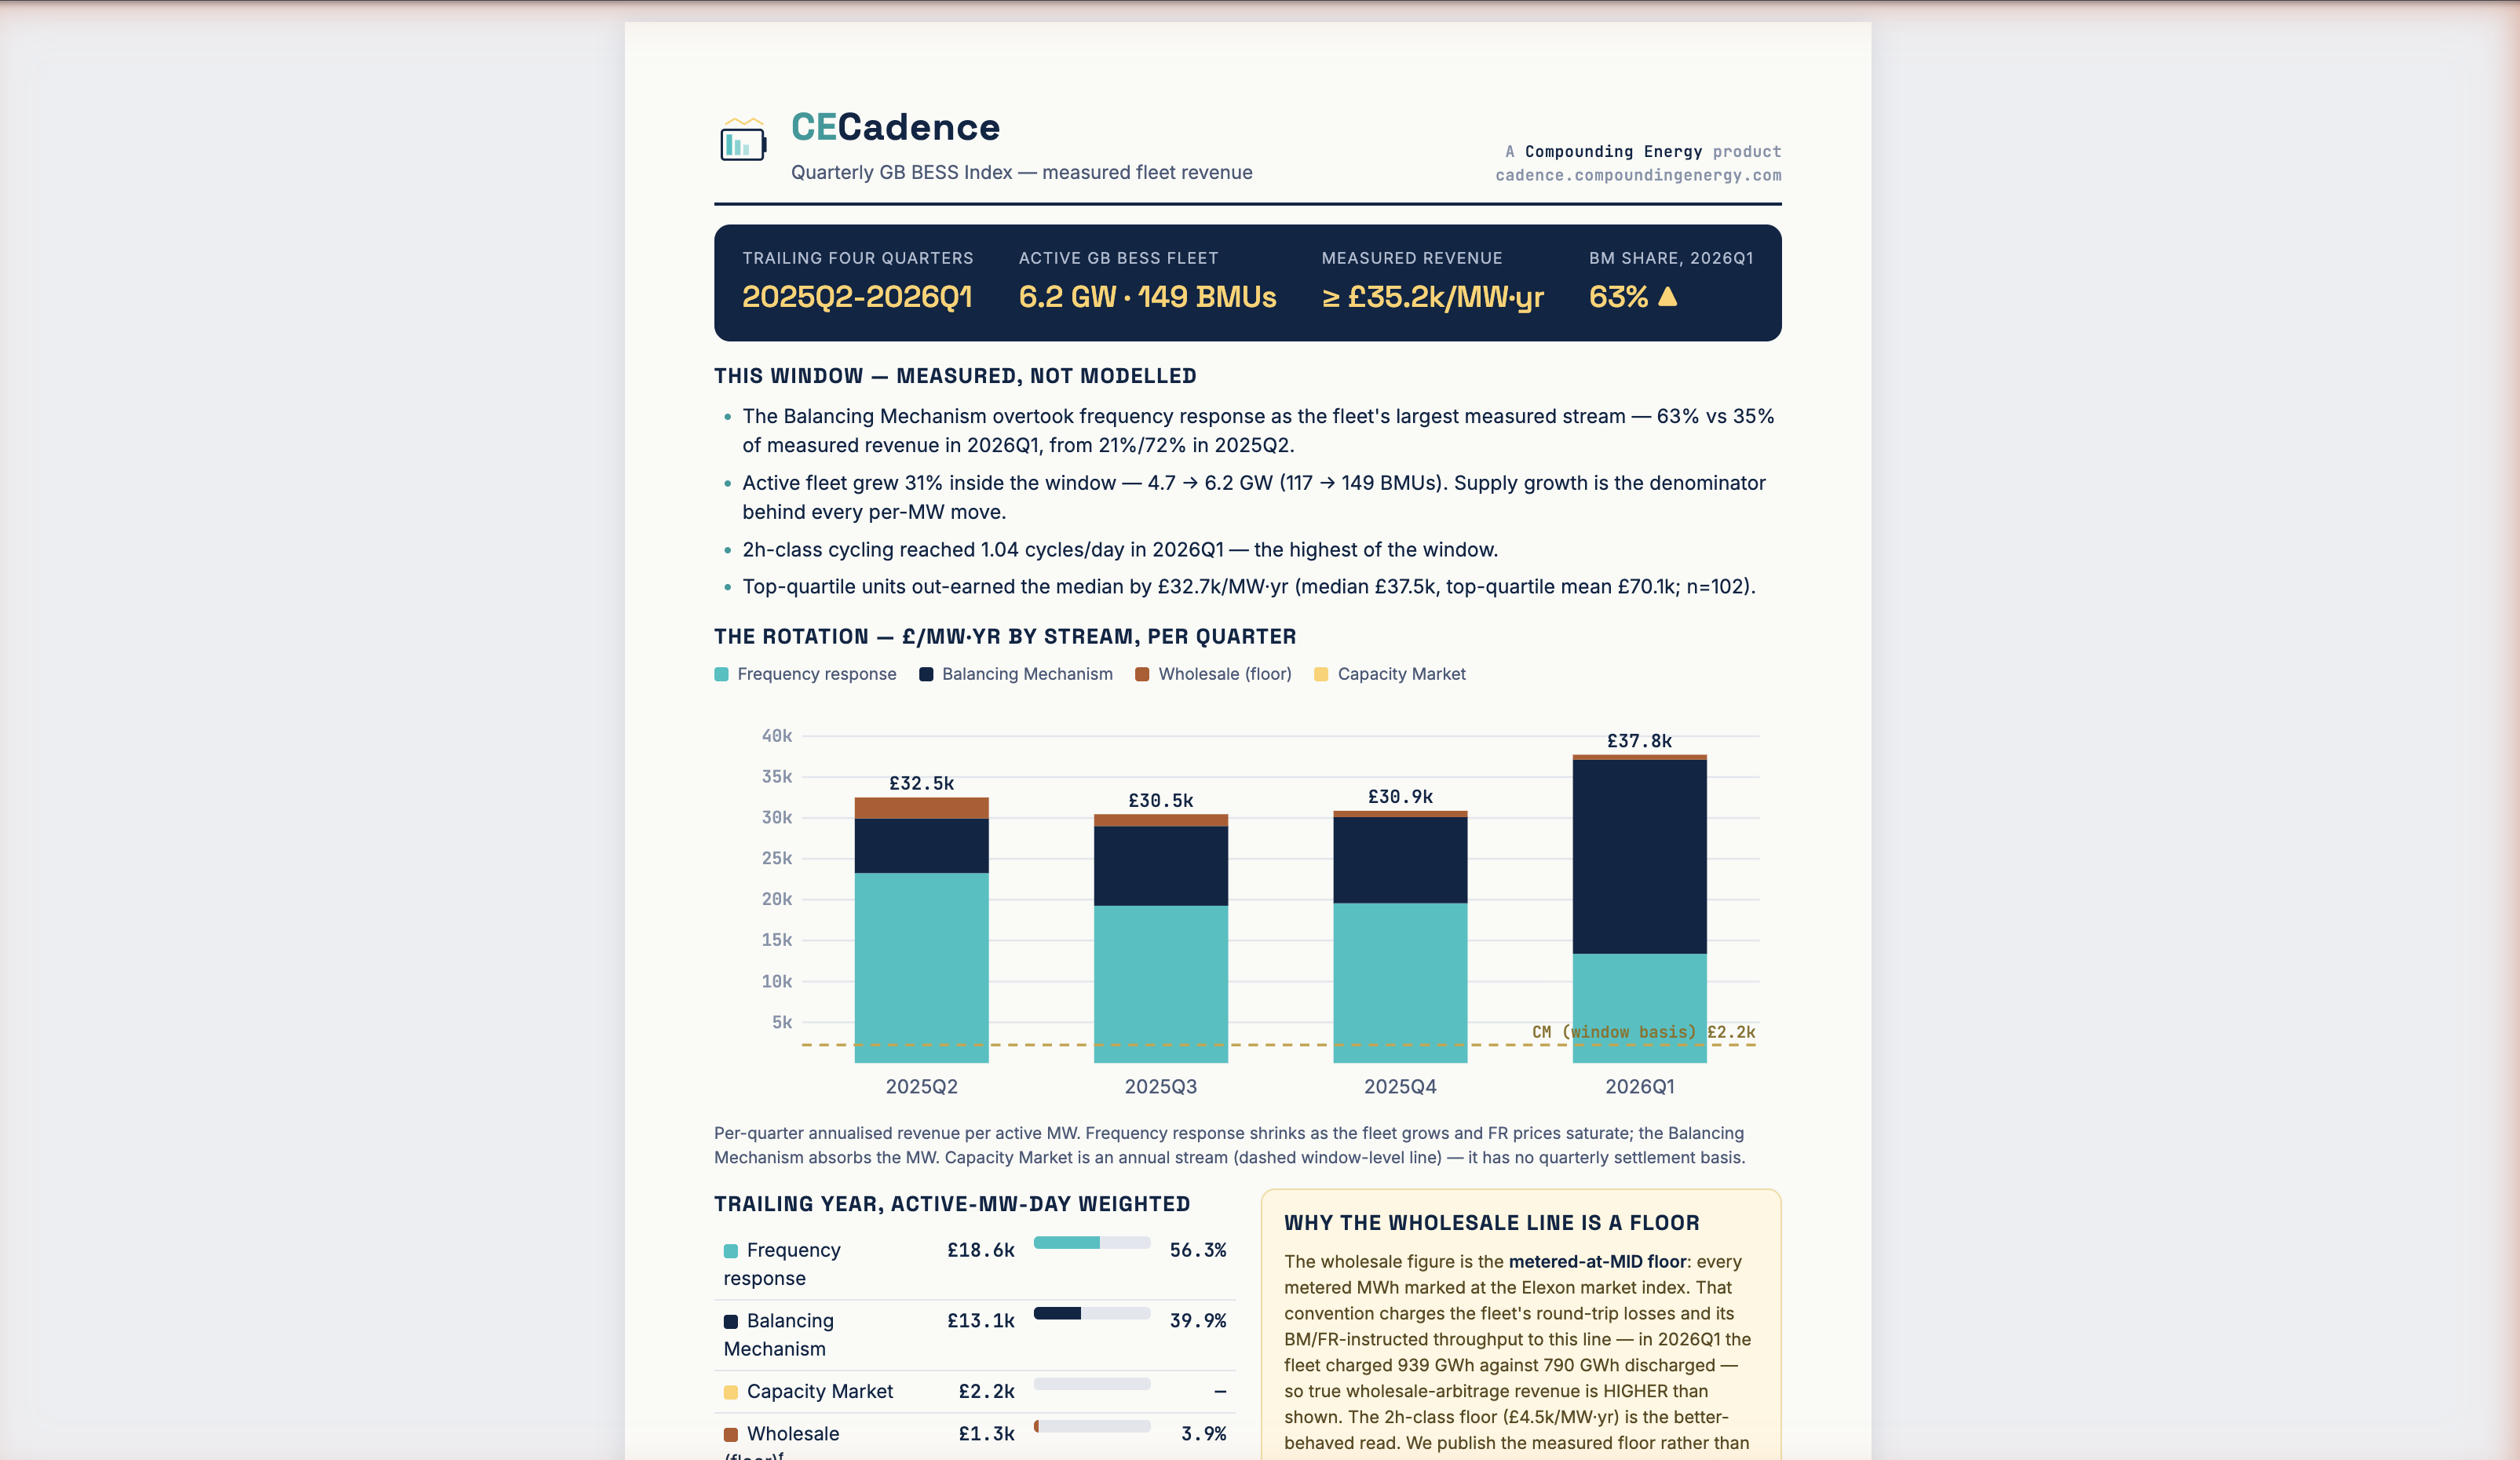

Forecasts that value each battery against today's prices can overstate 2030 GB battery revenue by 100–300%, because they leave out what the rest of a growing fleet does to the spreads. CECadence solves fleet build-out, half-hourly prices and dispatch by duration cohort together, to a fixed point, so a site's revenue already carries the cannibalisation from the batteries built alongside it.
Every product reads from the same fleet model, network topology and weather store, so a siting study, a price forecast and an expansion plan start from the same assumptions.

Our capacity-expansion and production-cost model: what to build, where and when, and what the system then costs to run, bus by bus. Full-year planning runs use Benders decomposition, with an investment master problem over parallel daily dispatch subproblems. It runs Scenario Studio on CEAtlas and the daily US nodal price forecast on CEAtlas Desk. Licensed.

Our LP/MILP solver, written in Rust. It routes each model to interior-point, simplex, first-order, branch-and-cut or decomposition methods, and on direct solves a separate certifier re-checks every optimal answer by default. CEGridSight's day-ahead price model and CECadence run on it in production. Licensed.

A model built only to forecast power prices, for trading and valuation.

Resource adequacy on the live fleet model: loss-of-load expectation by sequential Monte Carlo, capacity value (ELCC) and capacity-market clearing.

Wind project economics: yield with Gaussian wakes and a loss waterfall, costs, financing, and revenue against CEGridSight prices.

Solar project economics, with yield from the same Perez and thermal models CompoundVision uses.
Year three: CEDeris (DERs at fleet scale) · CENovaFuels (hydrogen, ammonia, e-fuels)
We store each forecast before the market settles and score it afterwards against what happened. The scores are public.
Each live product has a free tier and a public track record. Analyst and Desk plans can be bought online. Enterprise plans, licences and reports go through us.